02. Seaborn tips data
- - boxplot
- - swarmplot
- - lmplot
tips = sns.load_dataset("tips")
tips
tips.info()

x=tips["total bill"]
박스 가운데 선은 평균값

x="day", y="total_bill", data="tips"

- boxplot hue
- palette option
hue ="smoker"
: smoker yes, no 판단
palette="Set3'
: 색상 결정. Set1 ~ 3까지 있음.

- swarmplot
color
: 0(검정) ~ 1(흰) 색상 표현

- boxplot + swarmplot
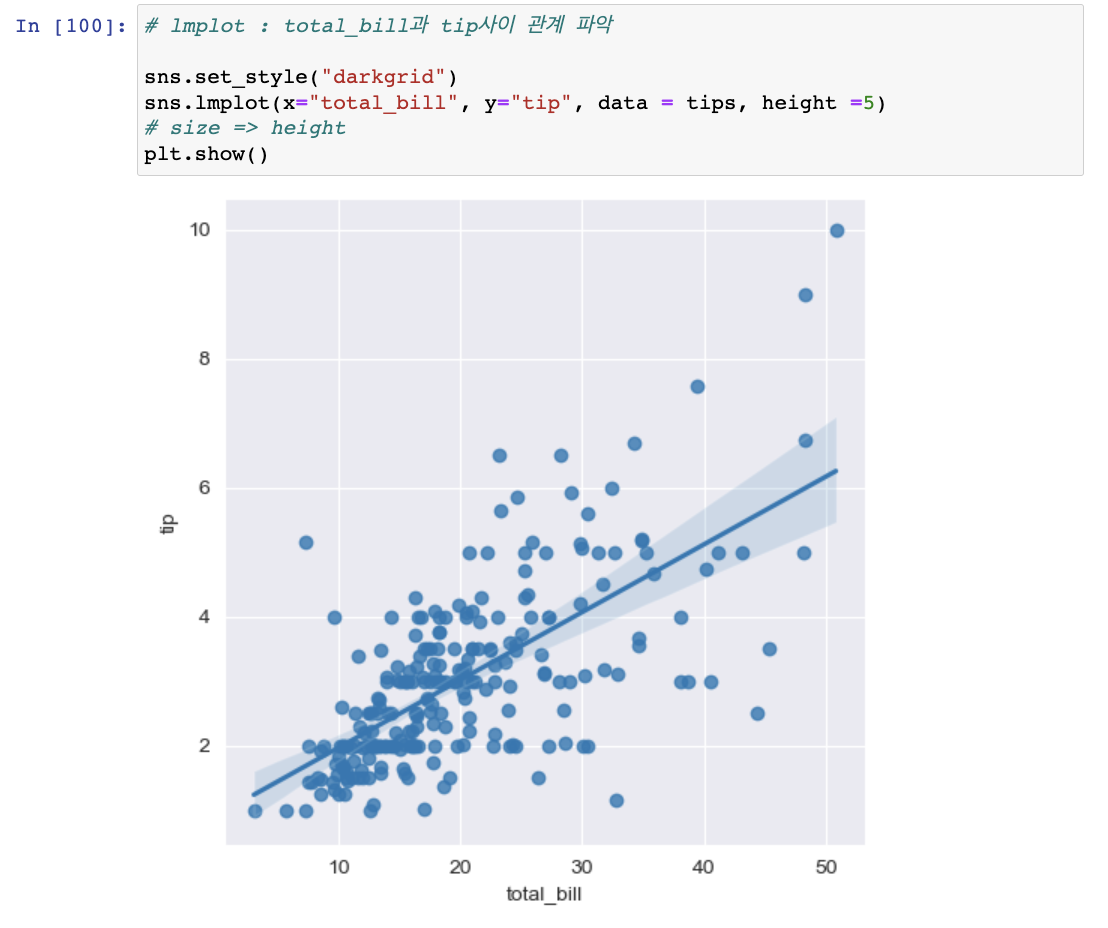
- lmplot
: total_bill과 tip의 상관관계 파악
여기서, size는 height로 표기됨.
▵데이터 구분되어 표기되어있지 않아
가독성 떨어짐.
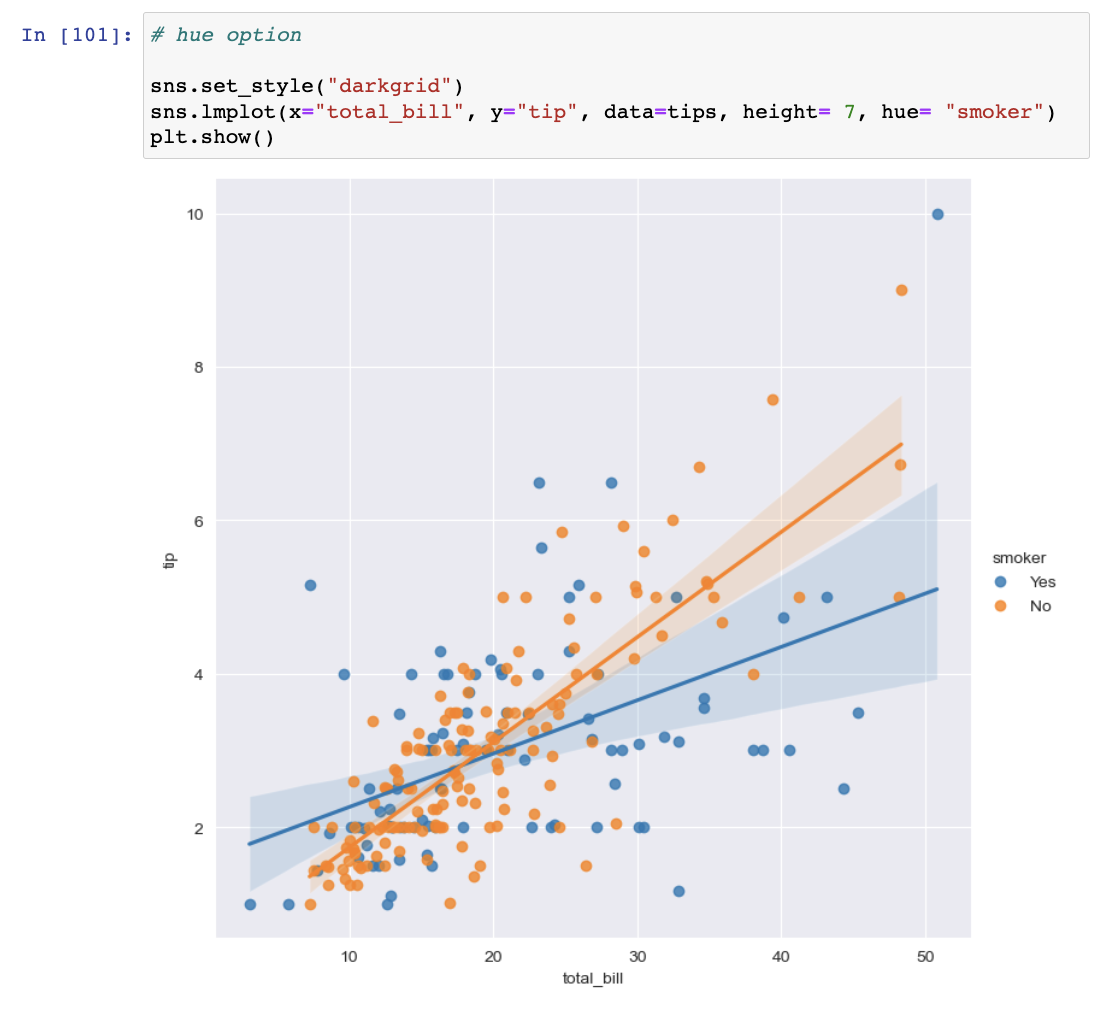
- hue option
: 위 데이터에 hue= "smoker" 표현하여
데이터 구분해주면서 상관관계 파악하기 편함. smoker 유무에 따라 표 보기 편해짐.
'Seaborn' 카테고리의 다른 글
| Examples 05. Anscombe data (0) | 2022.11.16 |
|---|---|
| Example 04.Iris data (0) | 2022.11.15 |
| Example 03.flight data (0) | 2022.11.15 |
| Example 01. seaborn basic (0) | 2022.11.14 |
| seaborn 정리 (0) | 2022.11.13 |


