https://matplotlib.org/stable/gallery/index
Examples — Matplotlib 3.6.2 documentation
Examples This page contains example plots. Click on any image to see the full image and source code. For longer tutorials, see our tutorials page. You can also find external resources and a FAQ in our user guide. Lines, bars and markers Images, contours an
matplotlib.org
✔️예시, 소스코드 있는 공식 문서
https://pandas.pydata.org/docs/reference/api/pandas.DataFrame.plot.html
pandas.DataFrame.plot — pandas 1.5.1 documentation
sequence of iterables of column labels: Create a subplot for each group of columns. For example [(‘a’, ‘c’), (‘b’, ‘d’)] will create 2 subplots: one with columns ‘a’ and ‘c’, and one with columns ‘b’ and ‘d’. Remaining colum
pandas.pydata.org
✔️ dataFrame 공식 문서. 값들 정렬 방법.
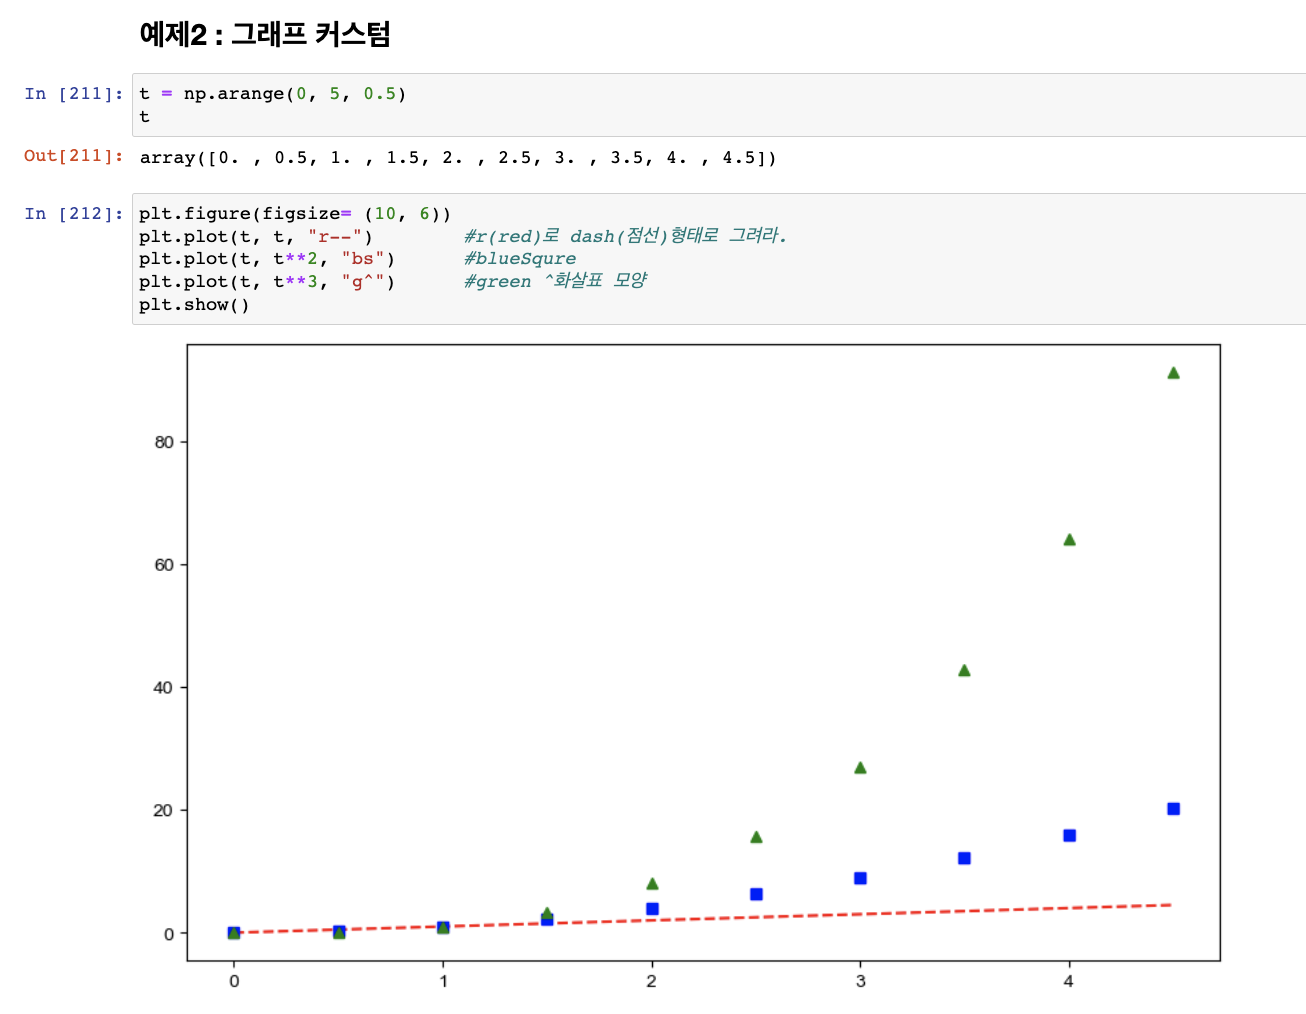
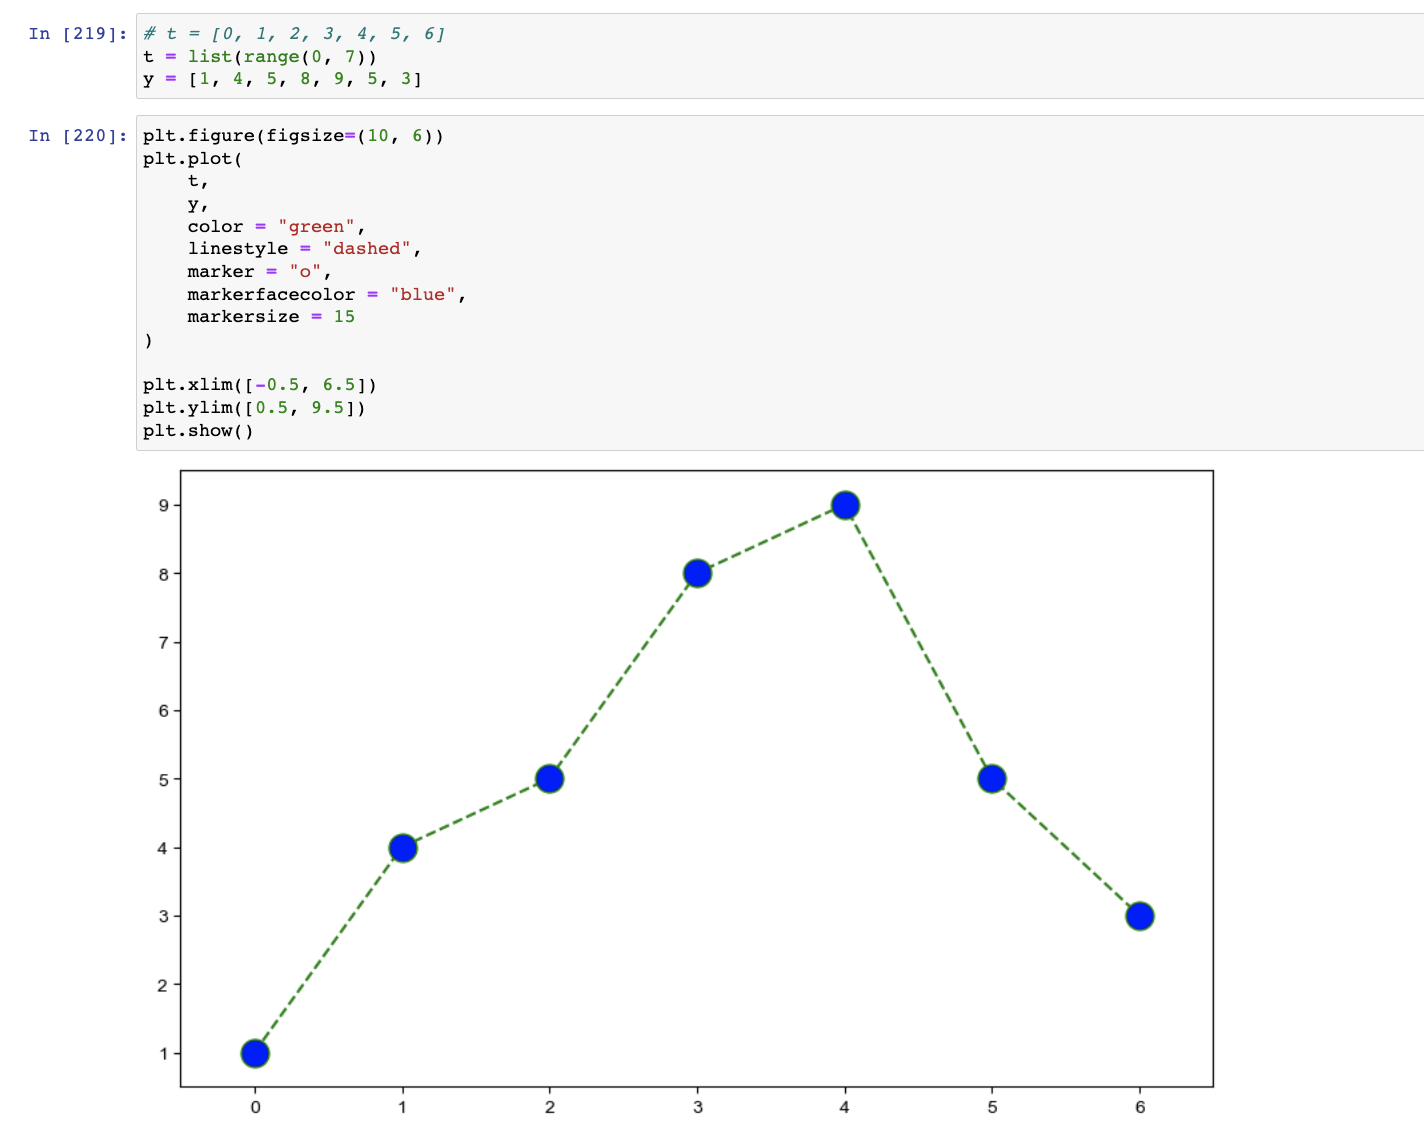
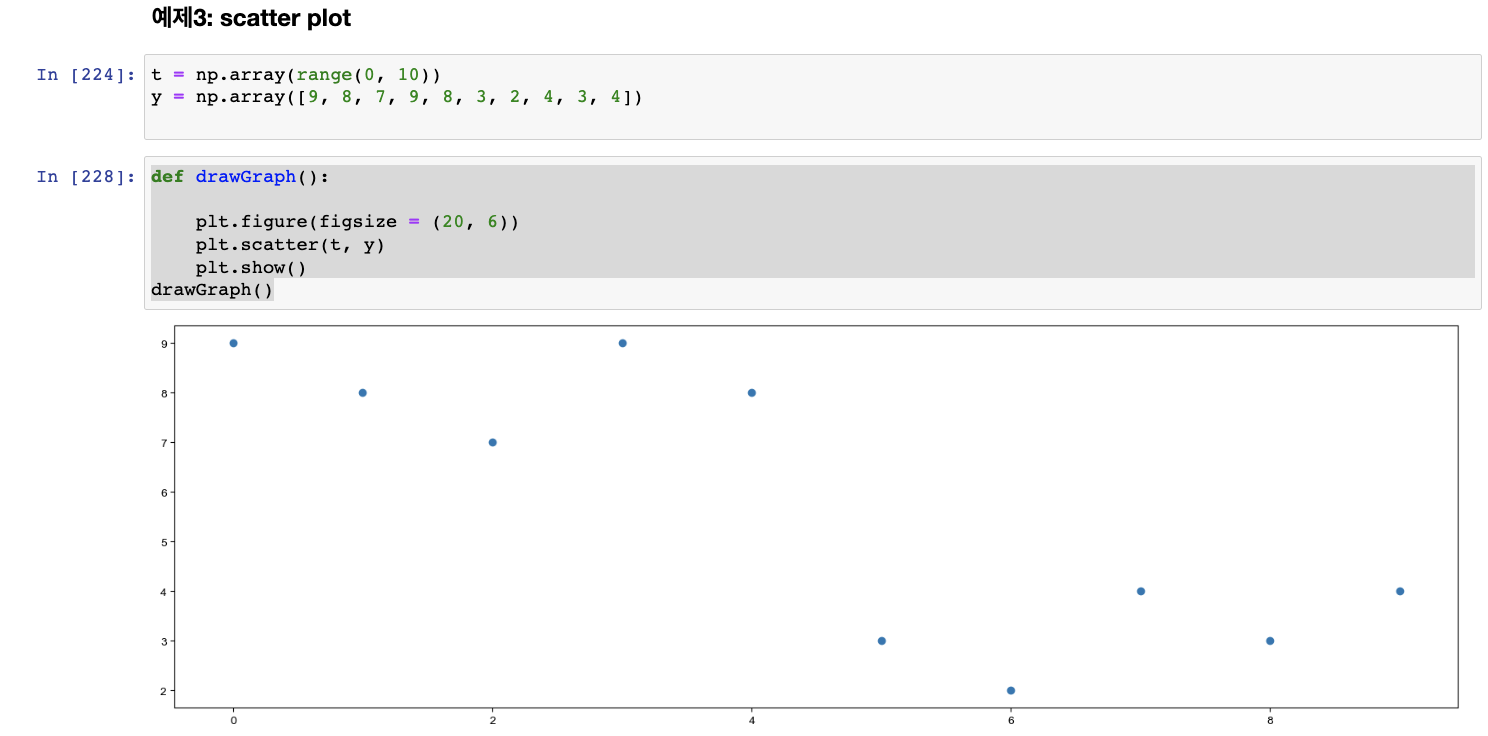
💡 maplotlib 그래프 기본 형태
plt.figure(figsize=(10, 6))
plt.plot(x, y)
plt.show


'Python' 카테고리의 다른 글
| [Python] unique / isnull / not null 데이터 확인 (0) | 2022.11.11 |
|---|---|
| Matplotlib_데이터 경향/ 오차/ 저장 (0) | 2022.11.09 |
| Pandas Data concat / merge / join (0) | 2022.11.09 |
| Pandas Basic (0) | 2022.11.08 |
| [Jupiter notebook] read_csv (0) | 2022.11.07 |


